In a prior article analyzing what is sound and what does a sound wave look like, we mentioned that there’s a vast field of content to unpack when it comes to understanding sound, how it’s generated, and how we perceive it.
In this article, we’ll shed a little more light (and colour) on sonic territory by delving into the world of sound visualization. Be wary of wild spectrograms and cymatics, and prepare to have your eyes, ears, and minds blown.
What Is A Spectrogram?
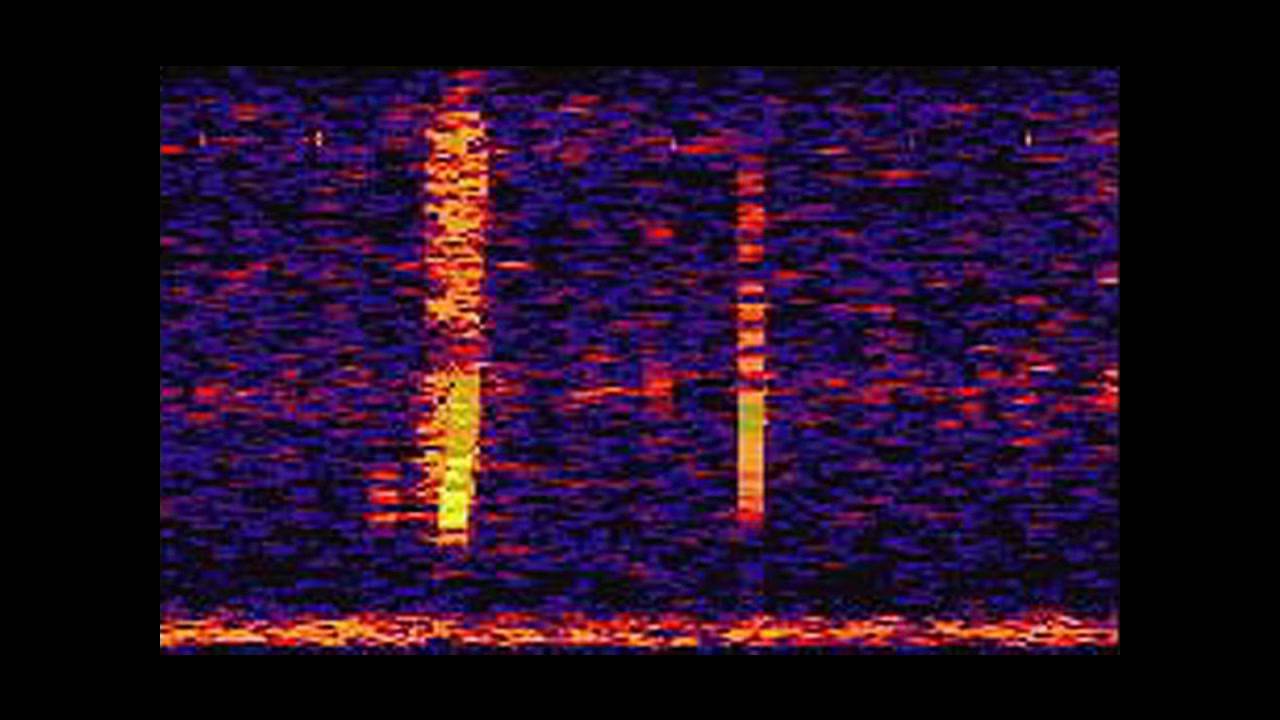
For those electronic music enthusiasts who have been with the genre since its infancy, this image might be familiar.

This is the face of renowned electronic music producer Richard D. James, more commonly known as Aphex Twin.
It’s technically a self-portrait of the producer’s face, but it wasn’t painted on a canvas or designed on a graphics editor. The image is wholly contained within the audio of one of James’ tracks.
When isolating the last 10 seconds of the song (which is called ” Δ Mi − 1 = −αΣ n=1NDi[n][ Σ j ∈ C[i]Fji[n − 1] +Fexti[n − 1]]”, by the way, but most people just call it “Equation”) and transposing it through a spectrogram, we can see a relatively clear image of the producer’s complacent face.
Aphex Twin certainly wasn’t the first person to toy around with this technique. A spectrogram is the fundamental tool scientists use to visualize sound. It’s an image that represents the spectrum of frequencies in a sound as they vary over time (or other variables).
Spectrograms are used to analyze frequency patterns in several fields such as seismology, oral communication, and the various animal calls found in the wild.
From Aphex Twin Portrait To Bloop: A Tale Of Another Spectrogram
Here’s a spectrogram you might have seen before.
This image is known as Bloop. This is a capture of an immensely powerful underwater sound with an ultra-low frequency discovered by the U.S. National Oceanic and Atmospheric Administration (NOAA) in 1997.
For a long time, the origin of Bloop was a complete mystery. Its audio profiling suggests that it could have come from a living creature, however its source was much, much louder than the blue whale, which is the loudest recorded animal to date.
Considering that the vast majority of the ocean is unmapped, wishful thinkers imagined the sound to have originated from a mountainous, undiscovered underwater beast, something like the Cthulhu from the Lovecraft novels. Sadly (or, rather, thankfully), those dreams were put to rest when the NOAA conclusively attributed the sound as having originated from a large ice quake.
Compared to Bloop, the image of Apex Twin’s self-portrait is vivid and very detailed. That’s because the producer knew exactly what he was after and he has a great understanding of what frequencies his sounds give out.
Every bit of sound in the 10-second mapping of Aphex Twin’s image is specifically tailored to produce the end result. Bloop, meanwhile, was sourced from a random natural occurrence. The spectrogram we get from Bloop is, by comparison, a run-of-the-mill wave pattern.
Spectrograms Are Not The Only Way To Visualize Sound
That’s not to say that all images sourced from natural sounds don’t come with their own aesthetic allure, and it’s not to say that spectrograms are the only way to visualize sound.
Here is the sound an Atlantic Spotted dolphin makes.
The image, sourced by Mark Fischer, was transposed through Fischer’s modification of the traditional spectrograph formula.
Fischer is an acoustics engineer who took the songs of whales and dolphins, and essentially transcribed them into spectrograms. He demonstrated a way to visualize a whale song and make it art, recording underwater animals from all over the world to produce entire collections of images.
“Spectrograms are infinite. They have no beginning and no end,” Fischer says. “They work well for visualizing musical scores or mechanical sounds, but there are very few sounds in nature that they can express in detail.”
Fischer’s visualisation technique is the result of a software program he wrote himself. It applies the mathematical concept of wavelets to recordings of animal calls in the wild and processes the wavelets into colour-coded visuals. This “remix” is called the Fourier transform (FT) and is a variation on the more commonly used spectrogram design.
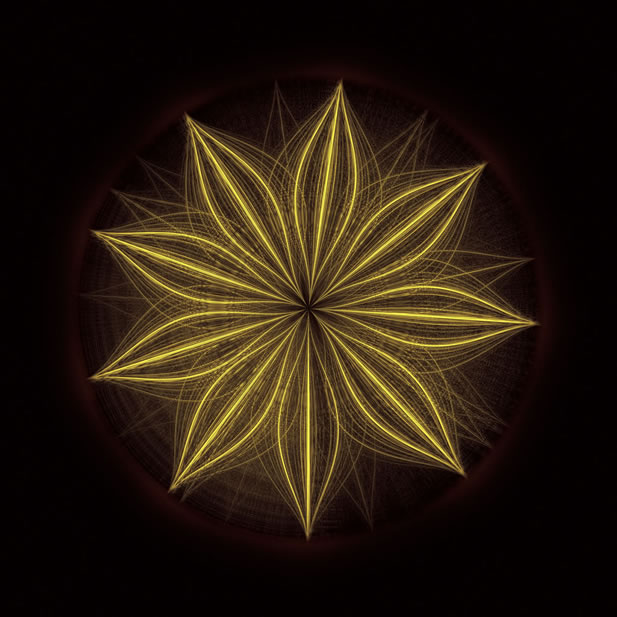
Cymatics Are A Form Of Audiovisual Art
Spectrograms and their variant offspring are simply one way to visualise sound. There are many others.
Within the field of sound visualisation, as you move away from spectrograms, you’ll eventually arrive at cymatics.
Cymatics can be described as the study of wave phenomena, sound waves, and their visual representation. How cymatics produces a visual by the auditory information it is receiving is perhaps the most impressive delivery of an image by sound that there is.
What you’re seeing here is cymatics at work. Cymatics show the contrast between objects that are stationary, such as the salt particles shown in the video above, and the vibrating surface supporting them.
Depending on the frequency with which the surface is vibrated, the particles will group together and pull apart to reveal the physical manifestation of the frequency itself. The higher the frequency, the more visually complex the pattern. In a way, cymatics are even more tangible visual representations of sound than spectrograms, since they operate through a physical medium.
Here is another example of cymatics. This time, we see a piece of artwork by Nigel Stanford based on cymatics.
Needless to say, with what we have here, we’ve only scratched the surface of what audiovisual art can accomplish.
Make Your Own Spectrogram
You can actually make your own spectrogram with your own voice or load in your favorite song to see what it produces.
There are all sorts of different ways to communicate sound by visual. If you’ve always wondered what sound looks like and have only thought of it in the form of sound waves, now you’ve seen a little more about how artful audio can be.
Follow Playlist